

A document can contain the answer in a paragraph, the exception in a table, the definition in a caption, and the meaning of the chart in the page layout around it. A text-only RAG pipeline turns that document into a sequence of chunks and hopes the important relationships survive.
Sometimes they do. Often they do not.
The failure is easy to miss because the retrieved text looks plausible. A table row without its column header is still readable. A figure caption without the figure still sounds informative. A paragraph extracted from a two-column page can even be returned in the wrong reading order. The model receives fluent fragments and produces a fluent answer, while the document’s structure has quietly disappeared.
The thesis: Multimodal RAG is not “put an image embedding next to a text embedding.” It is a retrieval system that preserves the evidence relationships a reader uses to interpret a page.
This article focuses on document-heavy workflows: technical manuals, policy packs, incident reports, research papers, financial statements, and slide exports. The goal is not to prescribe one vendor stack. The goal is to make the ingestion contract, retrieval units, citations, and evaluation criteria explicit.
Why the page is an evidence graph
A page is not merely a bag of tokens. It is a small evidence graph. A heading scopes the paragraphs below it. A table header gives meaning to the values in its cells. A figure has a caption, legend, axes, and nearby explanation. A footnote may narrow the claim made by the main body.
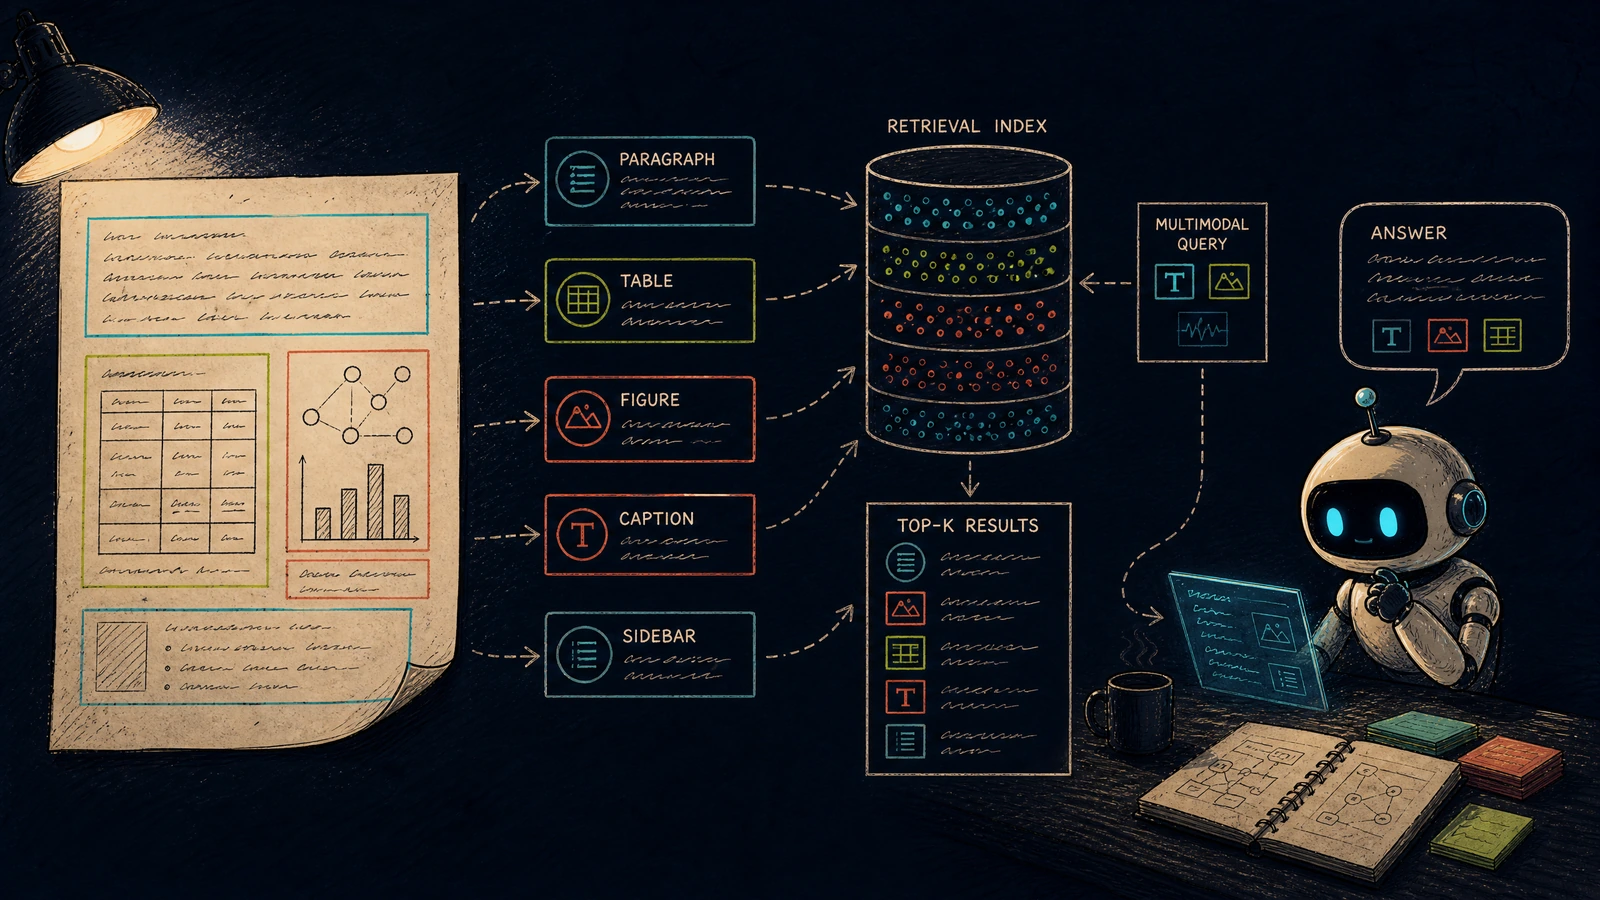
Consider a page with this structure:
| Region | What it contributes | What is lost by naive text chunking |
|---|---|---|
| Heading | Scope and topic | The chunk may be separated from its context |
| Paragraph | Explanation and definitions | Usually preserved, but reading order can break |
| Table | Exact values, categories, and exceptions | Headers, merged cells, and row relationships |
| Figure | Shape, trend, spatial relationship, or process | Visual meaning and labels |
| Caption | Interpretation and scope of the figure | The caption may be detached from its image |
| Footnote | Qualifier or limitation | A critical exception may be omitted |
The useful unit is therefore not always a chunk of 500 tokens. It may be a layout bundle: a table plus its header and caption, a figure plus legend and nearby explanatory paragraph, or a heading plus the section it governs.
Preserve structure at ingestion time
The retrieval problem is often decided before the first embedding is created. If the ingestion step discards coordinates, hierarchy, table structure, or source version, later components cannot recover them reliably.
A practical ingestion record can keep both the raw source and normalized regions:
type PageRegion = {
  regionId: string;
  documentId: string;
  version: string;
  page: number;
  type: "heading" | "paragraph" | "table" | "figure" | "caption" | "footnote";
  bbox: [number, number, number, number];
  text?: string;
  assetUri?: string;
  parentRegionId?: string;
  relatedRegionIds: string[];
};
The relatedRegionIds field is more important than it looks. It can connect a figure to its caption, a table to its heading, and a footnote to the claim it qualifies. Retrieval can then expand a hit into a controlled neighborhood instead of dumping an entire page into the prompt.
Keep multiple representations
A region may need more than one representation. A table can be stored as a structured grid, a textual serialization, and a rendered image. A figure can have its pixels, OCR text, caption, and a visual embedding. A paragraph can have normalized text plus the original page crop for citation.
These representations serve different jobs:
| Representation | Best for | Common failure if used alone |
|---|---|---|
| Text | Keyword search, exact terms, citations | Loses visual and relational meaning |
| Structured table | Row/column questions and calculations | May miss visual emphasis or merged layout |
| Rendered crop | Charts, diagrams, spatial relationships | Harder to search precisely |
| Caption and metadata | Scope and interpretation | Can oversimplify the image |
| Embedding | Semantic similarity across modalities | Similarity does not prove factual support |
The system does not need to expose every representation to the model. It needs to choose the cheapest representation that can answer the question and retain a path back to the original page.
Route queries by evidence type
A multimodal query is not always an image question. “What is the timeout?” may be answered by text. “Which quarter has the highest value?” may require a table or chart. “What does the red arrow indicate?” is fundamentally visual and spatial.
A router can classify the query into evidence needs before retrieval:
question → evidence plan

numbers / comparison      → table + surrounding heading
trend / spatial relation  → figure + legend + caption
definition / procedure    → paragraph + heading + footnote
mixed explanation         → text + table or figure bundle
This does not mean a separate LLM must decide every route. Lightweight signals such as numeric patterns, comparison words, “shown in the figure,” or references to a page region can provide a first pass. A model can refine the plan when ambiguity remains.
The router should also be allowed to request more evidence. If a table result has no header, the correct next step is not to answer from the row. It is to expand the retrieval neighborhood or ask for the source page.
Retrieve bundles, not isolated fragments
The most common multimodal RAG mistake is to retrieve a text paragraph and an image independently, then expect the model to reconstruct their relationship. The index should make useful relationships retrievable as a unit.
A bundle can include:
- The primary hit, such as a table row, figure, or paragraph.
- Its governing heading and caption.
- The smallest related region required to interpret it.
- A page crop or source locator for verification.
- A version and freshness field.
The bundle should be bounded. Returning every element on the page increases token cost and can bury the evidence that mattered. A good expansion policy is explicit: include the table header, the figure legend, the nearest heading, and a footnote only when the region links to it.

Do not confuse visual retrieval with visual reasoning
A visual embedding can find images that look semantically similar. That is useful for recall. It does not guarantee that the retrieved image contains the answer or that the model interpreted the axes correctly.
For numerical and compliance-heavy questions, preserve a structured representation whenever possible. Use the rendered image as supporting evidence and for citation, not as the only source of truth. For charts, store axis labels, series names, units, and data points if they can be extracted reliably. When extraction is uncertain, surface that uncertainty rather than converting a visual estimate into an exact number.
Ground answers at the right level
A document-level citation is not enough for multimodal evidence. Users should be able to open page 7, see the table or figure region, and understand which part supported the claim. The provenance record can include region IDs and bounding boxes alongside the textual citation.
A useful evidence envelope might look like this:
{
  "claim": "The peak occurs in Q3.",
  "evidence": [
    {
      "document": "quarterly-report.pdf",
      "version": "2026-06-30",
      "page": 7,
      "region": "figure_7a",
      "bbox": [0.18, 0.24, 0.82, 0.71],
      "support": "direct"
    },
    {
      "document": "quarterly-report.pdf",
      "version": "2026-06-30",
      "page": 7,
      "region": "figure_7a_caption",
      "support": "interpretive"
    }
  ]
}
This also helps with corrections. If the chart is replaced, the product can identify which claims used the old region and re-run only those claims. The citation is not merely a decorative link; it becomes a dependency edge.
Evaluate the relationships, not just answer similarity
A text-only evaluator may judge an answer correct because the final sentence resembles a reference answer. It can miss a wrong table row, a lost unit, or an answer that cites the right page but the wrong region.

Multimodal evaluation should combine deterministic and semantic checks:
| Dimension | Example check | Preferred grader |
|---|---|---|
| Region retrieval | The expected table, figure, or paragraph is in the top-k set | Region ID matcher |
| Structural integrity | Table headers, units, and row relationships are present | Schema and invariant checks |
| Evidence sufficiency | The cited region supports the whole claim | Rubric judge plus sampled human review |
| Numerical accuracy | The answer preserves value, unit, and comparison direction | Deterministic calculation |
| Locator correctness | Citation opens the region actually used | Page and bounding-box check |
| Cross-modal consistency | Text, table, and figure do not contradict each other | Conflict detector and review |
| Abstention quality | The system asks or qualifies when evidence is incomplete | Policy assertion |
Build adversarial cases around structure loss: remove a table header, swap two columns, detach a caption, change a unit, or place a footnote in a distant region. A system that only passes clean PDFs is not ready for the documents people actually upload.
A useful metric is evidence relationship recall: the percentage of required relationships that survive ingestion and retrieval. For a chart question, this might mean the figure, legend, axis unit, and caption all reach the answer context. The exact score is less important than making the relationship visible as a release criterion.
Control cost and context size
Multimodal retrieval can become expensive if every candidate is rendered, OCRed, embedded, and sent to a vision-capable model. A staged design keeps the common path cheap:
- Search text and structured metadata for high-recall candidates.
- Expand only candidates whose question requires layout or visual evidence.
- Use rendered crops for verification or visual reasoning.
- Pack the smallest bundle that preserves interpretation.
- Keep page-level locators for citations and later review.
The same principle applies to indexing. Not every page needs a high-resolution visual embedding. A text-heavy policy manual may benefit most from structured tables and source anchors. A diagram-heavy runbook may justify richer visual representations. Measure by query class instead of choosing a single representation for every page.
A practical rollout plan
Start with one document family and one question pattern, such as “find the value in this quarterly table” or “explain the architecture diagram.” Define the layout contract, preserve regions, and write tests for the relationships the answer needs.
| Phase | Deliverable | Gate |
|---|---|---|
| 1. Inventory | Region types, source versions, coordinates, and related-region links | No critical headers, captions, or footnotes are silently dropped |
| 2. Index | Text, structured, visual, and metadata representations | Each representation resolves to the same source region |
| 3. Route | Evidence plan based on query needs | Table, figure, and mixed questions take appropriate paths |
| 4. Bundle | Bounded neighborhood expansion | The model receives enough context without the whole page |
| 5. Cite | Region-level evidence envelope | User can open the supporting page region |
| 6. Evaluate | Relationship recall, structural integrity, accuracy, and abstention | Structure-loss regressions block release |
Multimodal RAG becomes reliable when the system treats layout as data. Tables are not paragraphs with pipes inserted between words. Figures are not decorative images. Captions and footnotes are not optional prose. They are relationships that help a reader decide what a source means.
The practical payoff is not simply better image search. It is an answer that can say, “This value comes from row three under the completed-orders column, and the footnote limits it to paid accounts.” That level of specificity is what turns multimodal retrieval from a flashy demo into infrastructure a team can trust.
Comments (0)