
The first AI trace I saw in production was technically complete and operationally useless.
It had a request ID, a 200 response, and a latency number. It did not tell us which model version made the decision, which retrieved passages shaped the answer, which tool was called, whether an MCP server was involved, how many tokens were consumed, or whether the trace had copied a customer secret into a log line.
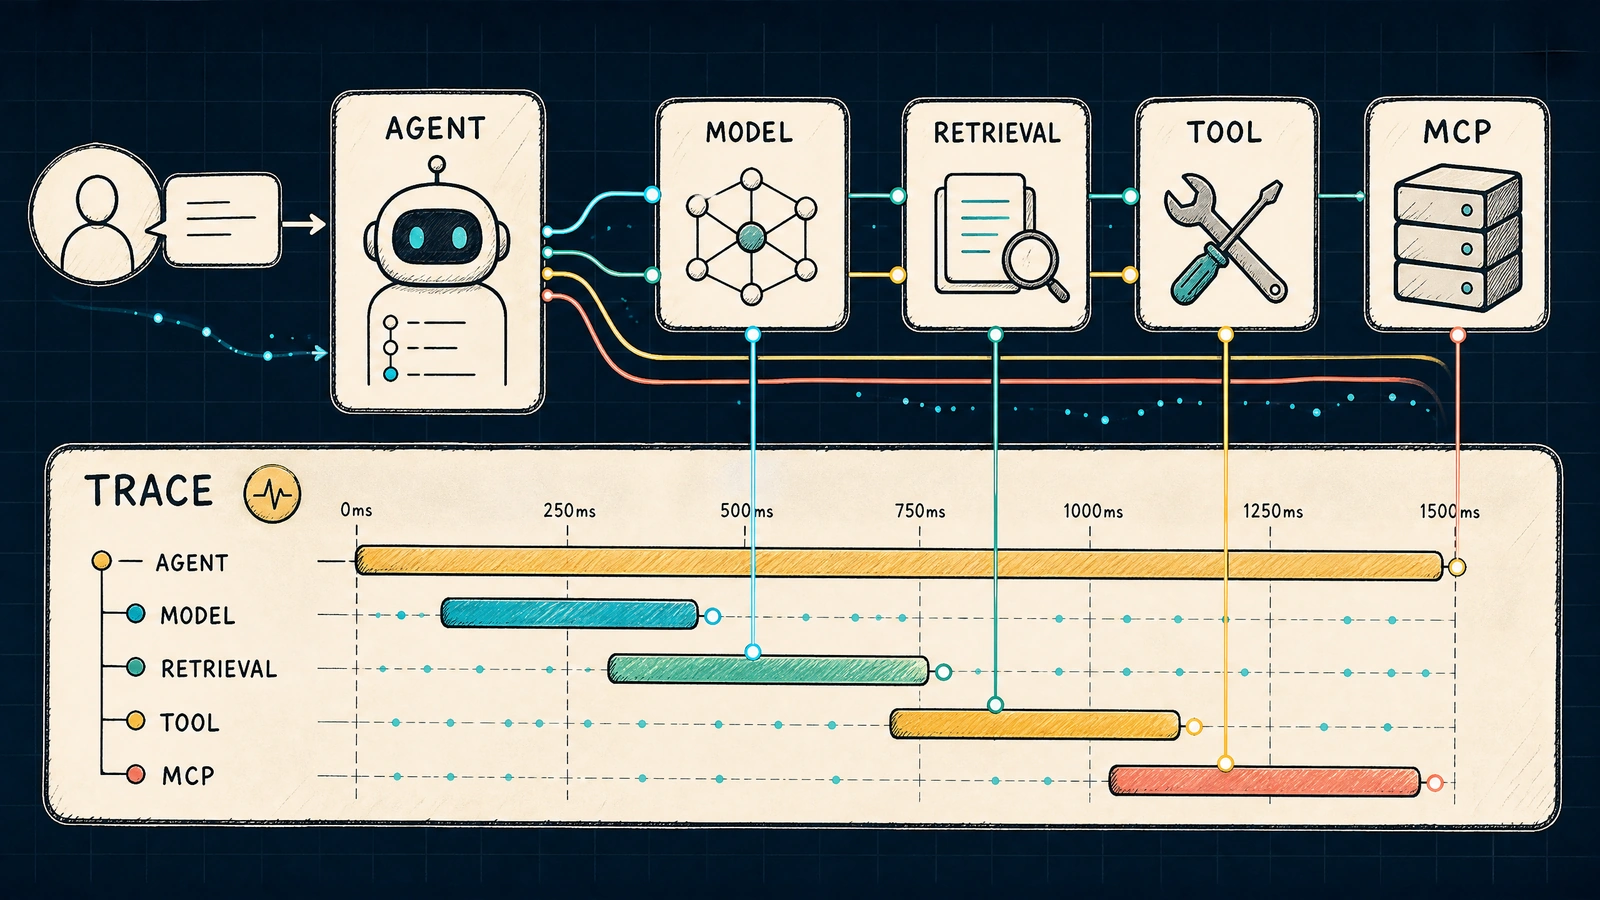
That is the observability gap in many AI systems. Teams add logging around an LLM call, but a production agent is not an LLM call. It is a distributed decision path that crosses model providers, retrieval systems, tool servers, policy gates, queues, human approvals, and external side effects.
OpenTelemetry’s GenAI semantic-conventions work is important because it treats these signals as a shared vocabulary rather than a provider-specific dashboard feature. The value is portability: a trace emitted by one model gateway should remain understandable after the team changes provider, router, orchestration framework, or MCP server.
Thesis: Telemetry is a contract between system boundaries. If the vocabulary changes every time the model provider changes, the organization does not own its observability.
Start with the execution graph, not the dashboard
Before choosing attributes, draw the path one user task takes through the system. A typical agent turn might contain:
request
  -> policy and tenant context
  -> model decision
  -> retrieval
  -> MCP initialize
  -> tool call
  -> external service
  -> model synthesis
  -> response and outcome
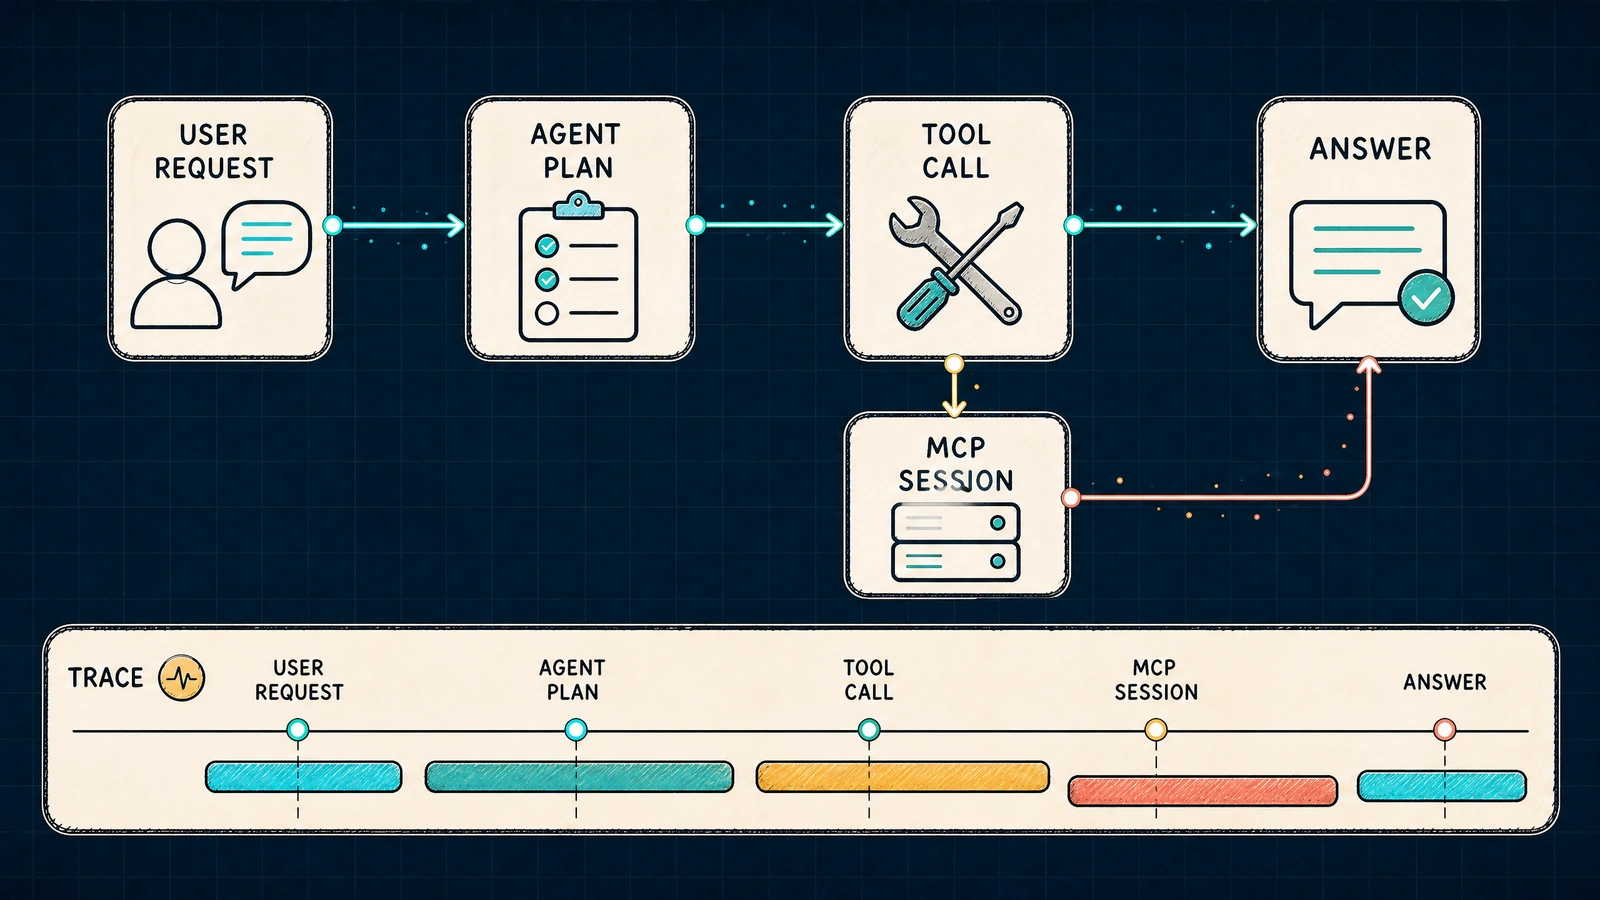
Each boundary has a different question. The model span asks which model and parameters were used. The retrieval span asks which index, query and documents were selected. The MCP spans ask which server, protocol version and capability were negotiated. The tool span asks what operation ran and whether it mutated state. The outcome span asks what actually happened outside the model’s prose.
A dashboard that shows only “LLM latency” cannot answer those questions. A trace that shows every prompt in plaintext may answer them while creating a data leak. The engineering problem is to record enough structure to debug behavior without copying the entire world into the logging system.
| Boundary | Core question | Useful signal |
|---|---|---|
| Model | Which inference decision occurred? | Provider, model, operation, token usage, finish reason |
| Retrieval | What evidence was made available? | Index, query hash, result count, document IDs, scores |
| MCP session | What protocol context was negotiated? | Server identity, protocol version, capabilities, outcome |
| Tool | What authority was exercised? | Tool name, schema version, approval, mutation class |
| Policy | Which guardrail decided? | Policy ID, decision, reason code, redaction count |
| Outcome | What changed in the world? | State diff, event ID, external request status |
The boundary map should exist before the instrumented code. It is an architecture artifact, not an afterthought for the SRE dashboard.
Use a stable core and extensible attributes
Semantic conventions work best when they separate a stable core from domain-specific detail. The core should be small enough to implement across providers and strict enough to support cross-system queries. Extensions can add router, MCP, retrieval, or business attributes without forcing every consumer to understand every field.
A minimal model call span might carry:
{
  "span.name": "gen_ai.chat",
  "gen_ai.operation.name": "chat",
  "gen_ai.system": "provider-gateway",
  "gen_ai.request.model": "model-family-a",
  "gen_ai.response.finish_reasons": ["tool_call"],
  "gen_ai.usage.input_tokens": 1380,
  "gen_ai.usage.output_tokens": 92,
  "gen_ai.response.id": "resp_7d2"
}
The exact attribute names should follow the adopted OpenTelemetry convention and the version pinned by the platform team. The design principle is more durable than any one field: stable meaning, explicit cardinality, documented sensitivity.
Do not put unbounded user text, full prompts, or entire retrieved documents into low-cardinality metric labels. A prompt hash, template ID, content classification, and redaction count are often more operationally useful than a raw prompt. Store richer evidence in a controlled trace store only when policy allows it.
| Signal type | Good for | Common mistake |
|---|---|---|
| Span attribute | One operation’s structured context | Put a full prompt into an indexed attribute |
| Span event | A meaningful point-in-time event | Emit every token as a high-volume event |
| Metric | Aggregated trend and alerting | Label by user ID, prompt, or document text |
| Log | Human-readable diagnostic detail | Duplicate secrets already present in traces |
| Link | Connect related asynchronous work | Force queue and child spans into one trace |
The observability schema should include a sensitivity classification. A field that is safe in a local debug trace may be unsafe in a shared metrics backend.
Instrument MCP as a protocol boundary
MCP is not merely another HTTP endpoint. Its specification defines lifecycle and capability exchange, along with tools, resources, prompts, roots, sampling and elicitation as distinct protocol concepts. Telemetry should preserve that shape.
At session initialization, record the server identity, protocol version, negotiated capabilities, transport class, and outcome. When a tool is listed, record the tool schema version or fingerprint rather than copying a potentially sensitive description into every trace. When a tool is invoked, record the logical name, validation result, approval state, and mutation class. When a resource is read, record its stable identifier and access decision.
mcp.session
  ├── mcp.initialize        protocol=2025-06-18, caps=tools/resources
  ├── mcp.tool.list         schema_fingerprint=sha256:...
  ├── mcp.tool.call         name=lookup_case, mutation=read
  └── policy.decision       decision=allow, reason=least_privilege
This makes a production question answerable: “Did the same agent behavior change because the model changed, because the MCP server advertised a new capability, or because the tool schema changed?” Without protocol-level spans, those causes collapse into one opaque model trace.
Avoid recording tool arguments by default. Classify arguments, redact sensitive fields, and retain a deterministic hash when correlation is needed. For high-risk writes, link the agent span to the approval record and the external request ID, but do not make the model’s text the only audit artifact.
Trace the evidence path without leaking the evidence
RAG systems create a hard observability trade-off. If a response is wrong, engineers need to know what evidence the model saw. If every retrieved chunk is stored in a general-purpose trace backend, the system may become a copy of the company’s knowledge base.
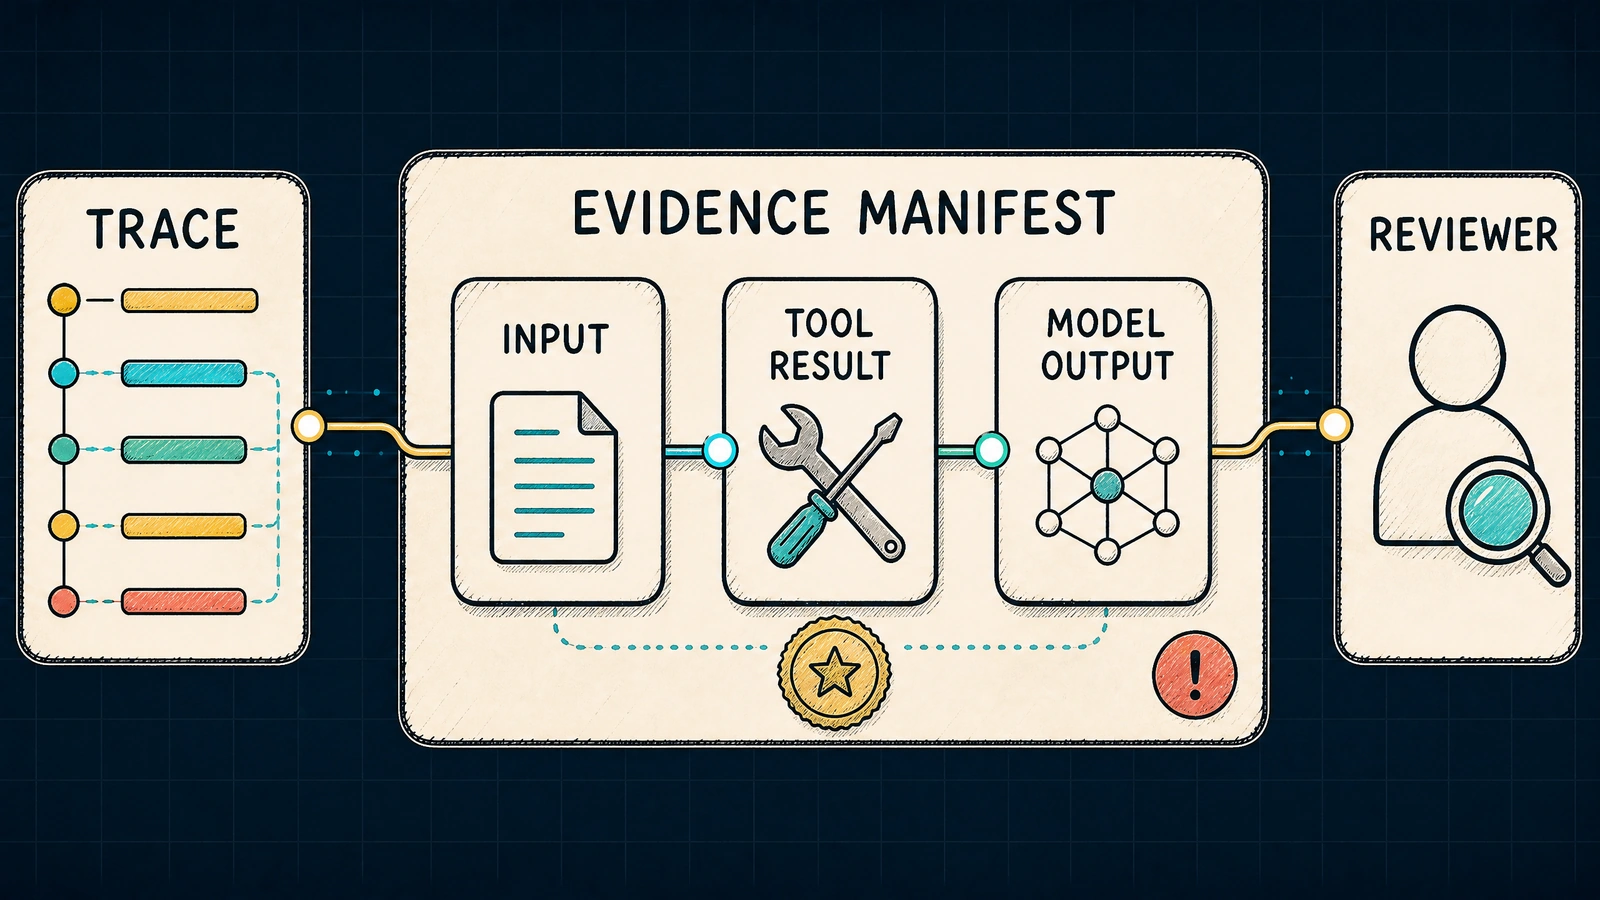
A safer design stores a retrieval manifest in the trace and keeps content under a separate access-controlled policy:
{
  "retrieval.index": "support-policy-v4",
  "retrieval.query_hash": "sha256:9a1...",
  "retrieval.result_count": 6,
  "retrieval.documents": [
    {
      "id": "policy-v2-section-03",
      "score": 0.84,
      "classification": "internal"
    }
  ],
  "retrieval.redacted": true
}
The manifest answers which documents and scores were involved. A privileged investigation path can resolve the document IDs if the incident requires it. Ordinary dashboards do not need the paragraph text.
This is also where provenance and temporal retrieval become operationally useful. If an answer was supposed to be valid on a historical date, the trace should record the inferred interval and the validity interval of selected documents. If the source was stale or superseded, the trace should make that visible.
Make cost and latency joinable with quality
Token usage is not a finance report. Latency is not user value. But both become useful when linked to the same workflow and outcome.
Record input and output tokens, cache hits, model route, retry count, queue wait, tool latency, and end-to-end duration. Then attach cost using a versioned pricing table outside the trace schema. Do not hard-code a price into a historical span; model pricing and internal allocation rules change.
A workflow-level cost record can look like:
{
  "workflow.id": "case-4821-turn-09",
  "model.cost_usd": 0.0124,
  "retrieval.cost_usd": 0.0003,
  "tool.cost_usd": 0.0041,
  "workflow.cost_usd": 0.0168,
  "outcome": "draft_created",
  "quality.bucket": "accepted_with_minor_edit"
}
The useful question is not “which model used the most tokens?” It is “what did a successful, safe outcome cost for this workflow and tenant?” That requires stable correlation IDs and a definition of success independent from the model response.
| Metric | Join with | Decision it supports |
|---|---|---|
| Cost per trace | Outcome and tenant | Budget, showback, route selection |
| p95 model latency | Tool and queue spans | Timeout and UX policy |
| Retry rate | Error class and provider | Backoff, failover, provider choice |
| Citation coverage | Retrieved document manifest | Retrieval and prompt changes |
| Unauthorized-action attempts | Policy decision | Safety hardening and release gate |
Privacy is part of telemetry design
OWASP identifies sensitive information disclosure as a major risk for LLM applications and recommends sanitization, strict access controls, tokenization, redaction, and careful system configuration. These controls cannot be bolted on after the trace schema has been copied into five backends.
Define a capture policy by field and environment. Development may capture a short, synthetic prompt. Staging may capture a redacted template and hashes. Production may capture only metadata for high-risk tenants. Incident mode can grant time-limited access to encrypted payloads with an explicit approval record.
field -> classification -> capture mode -> retention -> access owner
prompt -> confidential -> hash + template ID -> 7 days -> AI platform
tool args -> restricted -> schema + redacted values -> 30 days -> tool owner
raw document -> sensitive -> no default capture -> source policy -> data owner
Redaction should be observable without exposing the value. Record that three fields were redacted, which policy did it, and whether redaction changed the model input. This allows engineers to diagnose a quality regression without turning the telemetry store into a sensitive-data warehouse.
Use traces as release evidence, not only incident evidence
A portable semantic contract helps evaluation. A release case can assert that the agent emitted an MCP initialization span with the expected capability set, that a retrieval span carried a document manifest, that a write tool had an approval link, and that no raw secret appeared in an exported trace.
This makes observability itself testable. The team is no longer asking whether the dashboard looks populated. It is asserting that the production evidence needed to debug an AI decision exists and is safe to retain.
A useful telemetry test matrix includes missing spans, wrong parent-child relationships, cardinality explosions, sensitive-field leaks, inconsistent model names, and trace breaks across asynchronous queues. These failures should fail instrumentation tests before they fail an incident investigation.
Design for provider changes
Provider abstraction is often discussed as an API interface. The deeper requirement is semantic continuity. When a router moves a request from provider A to provider B, the trace should preserve the same workflow ID, operation name, evaluation cohort, policy decision, and outcome fields. Provider-specific attributes can be nested below that stable core.
If a dashboard query means “successful tool-calling workflows by model family and tenant,” it should survive a provider migration. If it does not, the organization has coupled observability to a vendor’s vocabulary.
Pin the semantic-convention version, document allowed extensions, and review schema changes like API changes. A field rename can break incident queries just as surely as a breaking endpoint change can break a client.
Closing perspective
The most valuable AI trace is not the longest trace. It is the trace that lets an engineer reconstruct a decision path, inspect the right evidence, understand the authority exercised, quantify the operational cost, and do all of that without creating a second data-leak channel.
OpenTelemetry’s GenAI direction gives teams a useful standards anchor. MCP gives the trace a protocol boundary richer than an HTTP request. Production discipline supplies the rest: a stable vocabulary, explicit sensitivity, bounded cardinality, evidence manifests, joinable cost signals, and tests that prove telemetry survives system change.
Build telemetry that travels. Your next model provider, router, orchestration library, and MCP server should change the implementation—not the meaning of your operational evidence.
Comments (0)