
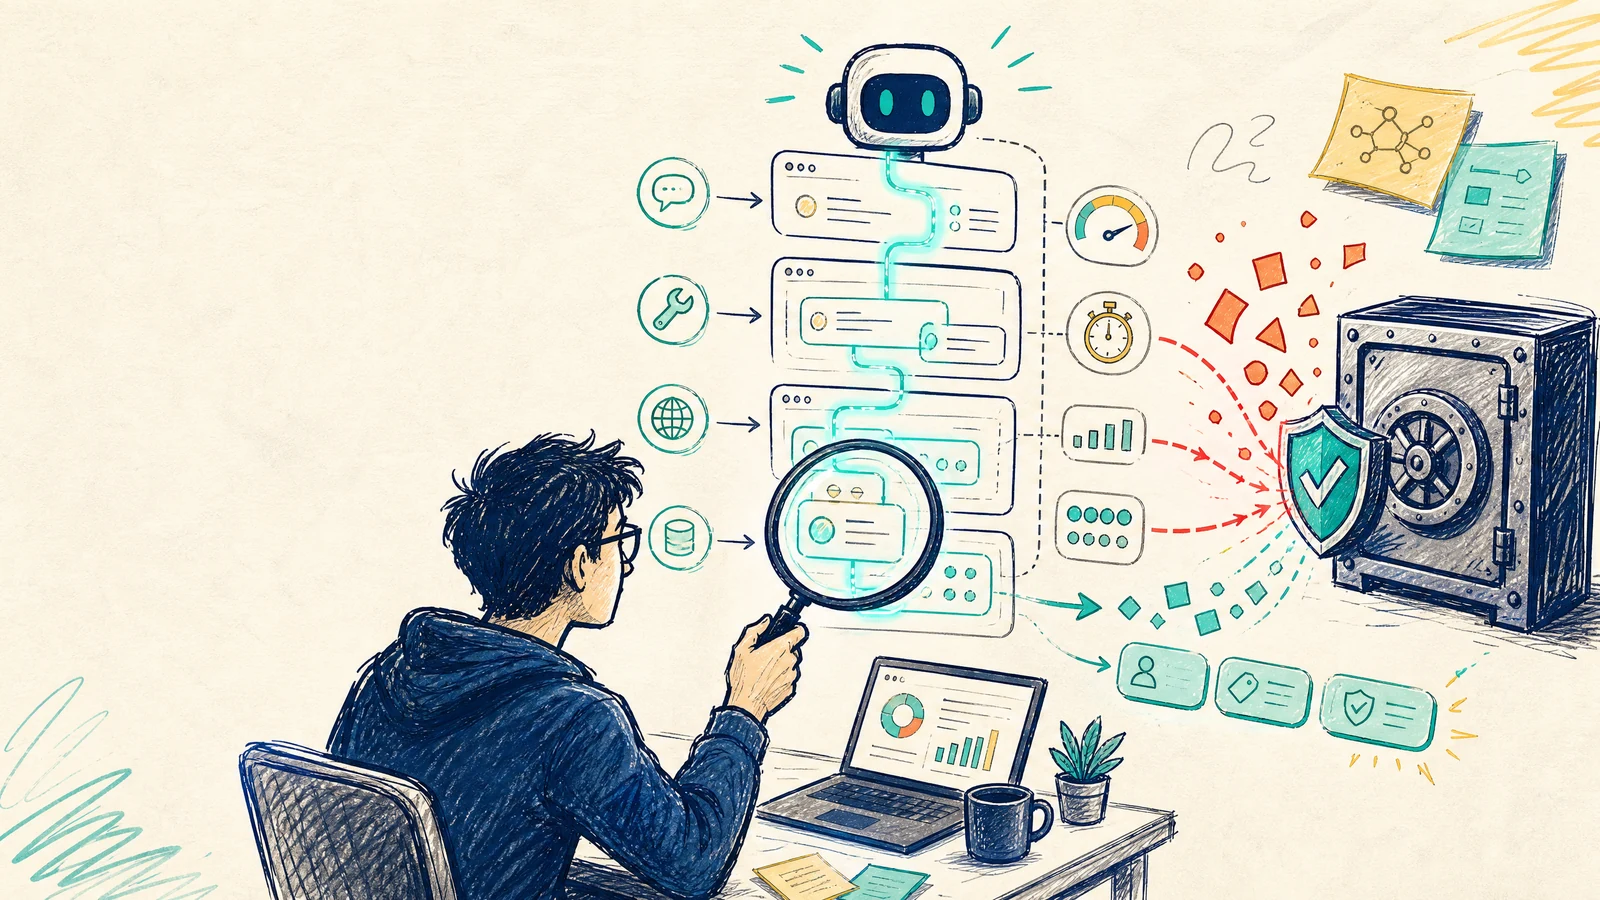
A support agent has just been slow, costly, and wrong. Yet the conventional dashboard is reassuring: every API request returned 200, p95 latency is below the service SLO, and there is no unhandled exception. One log line says tool=get_customer_profile; another says retry=1. None of that explains the incident. Did the agent select the wrong tool? Did it retry after an upstream failure? Which prompt revision produced the route? How many tokens did the retry consume? Did the trace exporter retain the authorization header that arrived inside a tool error?
The predictable response is to capture everything: the system prompt, user messages, retrieved chunks, tool arguments, tool results, completions, and perhaps model reasoning when a framework exposes it. That can make one investigation convenient while quietly creating a second data lake—one filled with customer conversations, credentials, PII, payment context, and internal payloads, but without the mature contracts, retention limits, reviews, and access controls of the primary systems of record.
The core principle: a trace is an execution record, not a conversation transcript. Preserve enough evidence to explain the agent’s path, cost, authority, and policy decisions. Route raw content through a separate, explicit, short-lived, access-controlled path.
This is not an argument for shallow observability. Tool-calling agents need more visibility than conventional request/response services: they branch, retrieve, retry, call models, invoke tools, and sometimes change the outside world. OpenTelemetry’s GenAI conventions provide useful vocabulary for model identity, token counts, duration, tool calls, and—only when explicitly enabled—content. The fact that content capture is off by default matters: observability is not the same thing as permission to collect text.
This article builds a practical production design for tracing prompts, tool calls, tokens, and cost without converting logs into a data-exposure surface. The running example is RelayDesk, a multi-tenant customer-support agent that searches a knowledge base, reads account state, creates refund drafts, and sends email after approval. Every customer value, secret, price, and trace sample below is synthetic.
Start with incident questions, not a vendor schema
Before choosing a tracing SDK or a backend, write down the questions an on-call engineer should answer in the first ten minutes of an incident. A field that cannot answer one of those questions should not enter default telemetry.
| Incident question | Evidence to retain | Evidence not required by default |
|---|---|---|
| Did the agent follow a safe workflow? | Trace ID, agent/version, span tree, route, tool name, result class, retry count | Full prompt and full tool payload |
| Why was it slow? | Duration for each LLM, retrieval, and tool span; queue time; timeout class | The complete response text |
| Why was it expensive? | Input/output tokens, model, price-card revision, loop/retry count, budget decision | The context-window content |
| Did it exceed its authority? | Capability class, authorization-scope class, approval state, allow/deny decision, side-effect class | Authorization header or access token |
| Did sensitive data pass through? | Data class, policy/revision, redaction category, number of affected fields | The original PII or secret value |
| Is exact content necessary for an exceptional investigation? | Evidence request ID, retention class, approver/audit event, encrypted pointer | A permanently open transcript for every engineer |
The question design prevents a dangerous premise: that reading raw content is the only way to debug. It frequently is not. If tool.get_customer_profile is slow, retries three times because of UPSTREAM_429, and has a restricted output class, you already have a disciplined investigation path without seeing an address, a card number, or a bearer token.
NIST frames post-deployment AI monitoring as more than infrastructure availability. It includes functionality, operations, human factors, security, and compliance. Its recent review also identifies fragmented logging, degradation detection, and balancing automated with human-validated monitoring as recurring challenges. An agent dashboard that only shows latency is therefore an incomplete operating model.
Separate four telemetry planes instead of stuffing everything into span attributes
A defensible design separates evidence by the question it serves, the people who may read it, and its retention policy. A single giant span JSON gives you the worst of both worlds: too little structure for operations and too much content to protect.
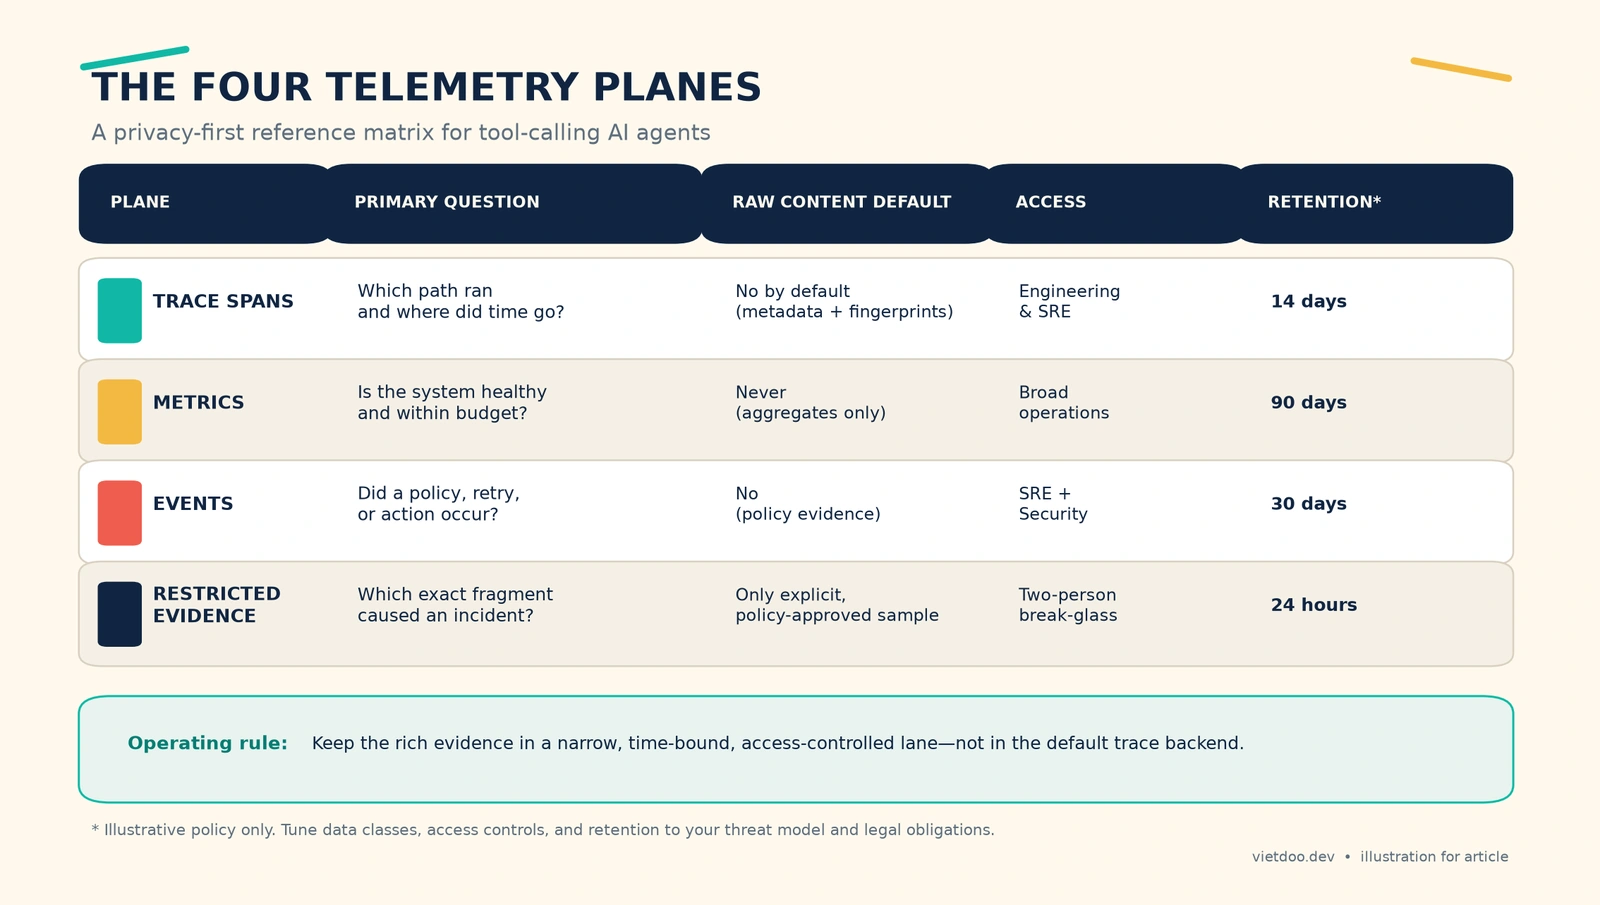
| Telemetry plane | Primary purpose | Unit of data | Default raw-content posture | Typical reader |
|---|---|---|---|---|
| Trace spans | Explain execution path, dependency, latency, and error | Parent/child span with low-cardinality attributes | No; metadata, fingerprints, safe summaries | Engineering and SRE |
| Metrics | Detect health and budget trends | Aggregated counters, histograms, gauges | Never | Broader operations |
| Events / audit logs | Establish that a policy, retry, approval, or side effect occurred | Strongly typed event | No; decision evidence only | SRE and Security |
| Restricted evidence | Investigate the rare case where an exact fragment matters | Sanitized snapshot or encrypted pointer | Explicit sample only | Two-person break-glass workflow |
OpenTelemetry’s own sensitive-data guidance makes the responsibility clear: instrumentation cannot know what is sensitive in a specific business context. Implementers need to review emitted data, apply data minimization, collect only what serves an observability purpose, and consider aggregation or anonymization where possible. “Turn on auto-instrumentation and inspect it later” is not a production data architecture.
Use spans to preserve execution shape, not to carry payloads
For RelayDesk, an agent root span could carry a compact evidence envelope:
agent.name                  = relaydesk.support
agent.version               = 2026.08.13.3
agent.route                 = account_issue
agent.policy.version        = privacy-v7
session.correlation_id      = hmac:9f2b…
trace.content.mode          = metadata_only
agent.final.outcome_class   = refund_draft_created
A model child span can include the deployment, template revision, token usage, finish reason, and estimated cost. A tool span can include tool name, capability class, schema revision, argument shape, result class, duration, retries, and effect. None of those fields requires a customer name, an entire prompt, or a raw JSON result.

OpenTelemetry’s GenAI observability walkthrough uses the same essential hierarchy: an agent/root invocation with child chat and tool-execution spans, plus attributes for model identity, tokens, and finish reasons. When content recording is enabled, full messages and tool information can be attached. That is a policy choice, not a harmless default.
A minimum trace model for a tool-calling agent
Teams commonly mix three distinct categories of information:
- Identity and revision identify the agent, prompt template, tool schema, model deployment, and policy revision. They let you compare runs meaningfully.
- Behavior captures routing, tool sequence, retries, guardrail decisions, and side-effect class. It establishes what the agent did.
- Payload contains prompts, retrieved documents, tool arguments/results, and completions. It has the highest privacy and security risk and should not occupy the default path.
The following schema is intentionally vendor-neutral. The attribute prefixes can vary; the data contract should not.
| Span or event | Safe attributes to retain | Payload to govern separately |
|---|---|---|
agent.run |
Agent name/version, route, outcome class, risk tier | Conversation history, memory text |
llm.generate |
Model, template revision, token counts, finish reason, cost, content fingerprint | System prompt, user text, completion |
retrieval.search |
Index revision, query class, k, result count, relevance band, HMAC document references |
Query text and retrieved chunks |
tool.call |
Tool/schema name, capability, argument shape, result class, effect, retry count | Arguments, body, headers |
policy.redaction |
Policy revision, data class, action, match category, count | The matched value |
approval |
Approval required/state, approver role, decision latency | Customer-specific justification text |
A RelayDesk incident without a transcript
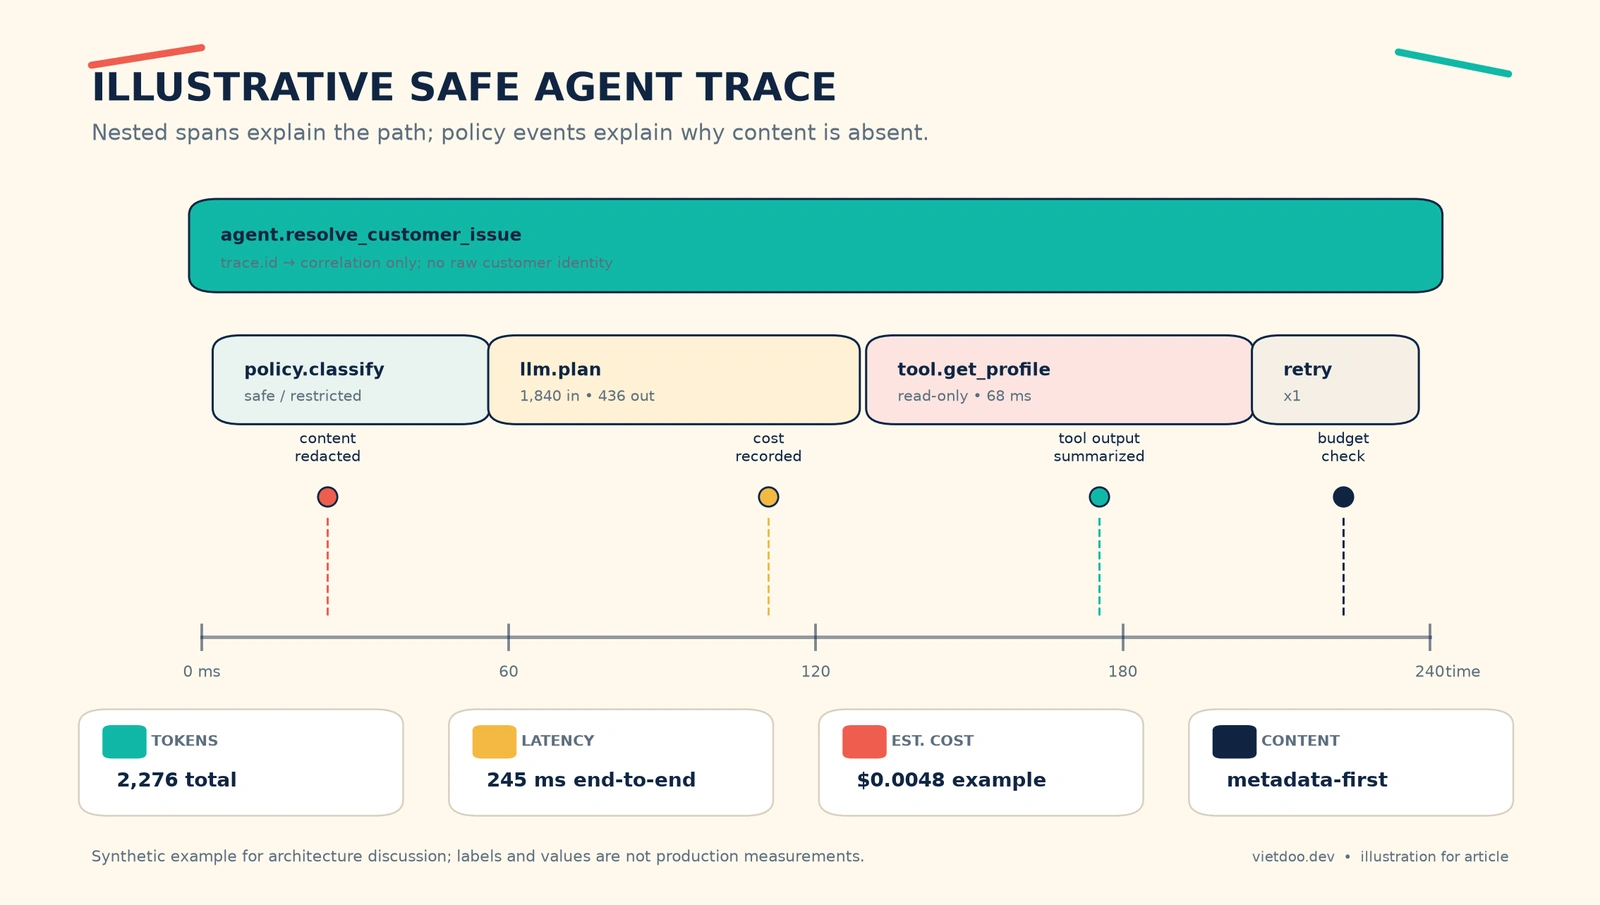
Assume RelayDesk receives: “I was charged twice. Check my account and issue a refund if that is correct.” It calls get_customer_profile, then lookup_billing_events, and finally creates a refund draft. The billing tool times out once and the agent retries.
A metadata-first production trace can still say this:
trace.id=7b4e…  agent.version=2026.08.13.3  tenant.tier=regulated
├─ policy.classify           8ms   class=restricted  action=redact
├─ llm.plan                 91ms  model=… input=1840 output=436 cost=$0.0048
├─ tool.get_customer_profile 68ms capability=customer.read result=found effect=read_only
├─ tool.lookup_billing       61ms capability=billing.read result=upstream_timeout retry=1
├─ tool.lookup_billing       54ms capability=billing.read result=found effect=read_only
└─ tool.create_refund_draft  39ms capability=refund.draft approval=required effect=staged
That tells the on-call engineer that the agent retried once, ended with a staged—not externally executed—action, and spent more because of an additional model/tool path. It does not reveal the customer’s billing records, street address, email, or upstream header.
A trace ID is a correlation handle. It is not a ticket that grants access to a transcript. Treating it as one collapses the boundary between normal observability and exceptional evidence access.
Classify data before capture: allow, summarize, tokenize, redact, or drop
Redaction is not the last regex in a pipeline. It is a data-contract decision that should happen before the exporter sends a span out of the process. Every prospective field should take one of five paths.
| Example data class | Default action | Evidence that remains | Why it is useful |
|---|---|---|---|
| Public or technical metadata | Allow | Tool name, model alias, status class | Required for routine operation, not directly identifying |
| Low-risk internal text | Summarize | intent=duplicate_charge, response_topic=refund_policy |
Preserves operational meaning while discarding wording |
| Correlation key | HMAC / tokenize | customer_ref=hmac:…, document_ref=tok:… |
Joins related work without disclosing original IDs |
| PII, credentials, or confidential content | Redact | Match category and field count | Proves policy execution without retaining the secret |
| Material with no observability purpose | Drop | No field | Minimizes the attack surface |
Hashing alone is not an anonymization guarantee. OpenTelemetry explicitly warns that a hash of a small or predictable input space—for example a numeric user ID—may be reversible in practice. If you need a correlation key, prefer an HMAC managed as a secret, scoped by tenant or rotation window, and still access-controlled as sensitive telemetry. Do not put an unsalted SHA-256 email hash on a broad dashboard and call the system privacy-preserving.
A metadata-first TypeScript instrumentation wrapper
The point of the wrapper below is not to redact a complete object after it exists. It constructs a safe telemetry envelope from the start. Treat it as a pattern; map field names to the SDK and semantic conventions you use.
import crypto from "node:crypto";

type DataClass = "public" | "internal" | "restricted" | "secret";
type SafeAction = "allow" | "summarize" | "tokenize" | "redact" | "drop";

type SafeField = {
  dataClass: DataClass;
  action: SafeAction;
  fingerprint?: string;
  summary?: string;
  redactedFields?: number;
};

const key = Buffer.from(process.env.TELEMETRY_HMAC_KEY!, "base64");

function fingerprint(value: string): string {
  // This is a controlled correlation key—not a claim of anonymization.
  return crypto.createHmac("sha256", key).update(value).digest("base64url").slice(0, 20);
}

function inspectForTelemetry(input: string, kind: "prompt" | "tool_result"): SafeField {
  if (/authorization:\s*bearer/i.test(input) || /(?:api[_-]?key|password)=/i.test(input)) {
    return { dataClass: "secret", action: "redact", redactedFields: 1 };
  }
  if (/\b\d{3}-\d{2}-\d{4}\b/.test(input) || /\b[\w.+-]+@[\w.-]+\.[A-Za-z]{2,}\b/.test(input)) {
    return { dataClass: "restricted", action: "redact", redactedFields: 1 };
  }
  return {
    dataClass: "internal",
    action: "summarize",
    fingerprint: fingerprint(input),
    summary: kind === "prompt" ? "intent:account_support" : "result:customer_profile_found",
  };
}

function traceToolCall(span: { setAttribute(k: string, v: string | number | boolean): void }, req: {
  toolName: string;
  schemaVersion: string;
  capability: "read" | "draft" | "write";
  argumentsJson: string;
  resultJson: string;
  durationMs: number;
}) {
  const args = inspectForTelemetry(req.argumentsJson, "prompt");
  const result = inspectForTelemetry(req.resultJson, "tool_result");

  span.setAttribute("agent.tool.name", req.toolName);
  span.setAttribute("agent.tool.schema.version", req.schemaVersion);
  span.setAttribute("agent.tool.capability", req.capability);
  span.setAttribute("agent.tool.duration_ms", req.durationMs);
  span.setAttribute("agent.tool.arguments.action", args.action);
  span.setAttribute("agent.tool.result.action", result.action);
  span.setAttribute("agent.tool.result.class", result.summary ?? "content_redacted");
  span.setAttribute("agent.policy.redacted_fields", (args.redactedFields ?? 0) + (result.redactedFields ?? 0));

  // Deliberately absent: argumentsJson, resultJson, authorization header, raw prompt.
}
This is not a replacement for DLP or semantic PII detection. It establishes a safer default shape: a normal code path never attaches the raw payload in the first place, regardless of exporter retries, sampling decisions, or backend changes. Grafana describes the same ordering in its SDK-side secret sanitization: messages, system prompts, tool calls, and tool results are sanitized before generation data is exported; server-side guards provide a second, centralized policy layer.
Build a layered redaction pipeline because every layer has blind spots
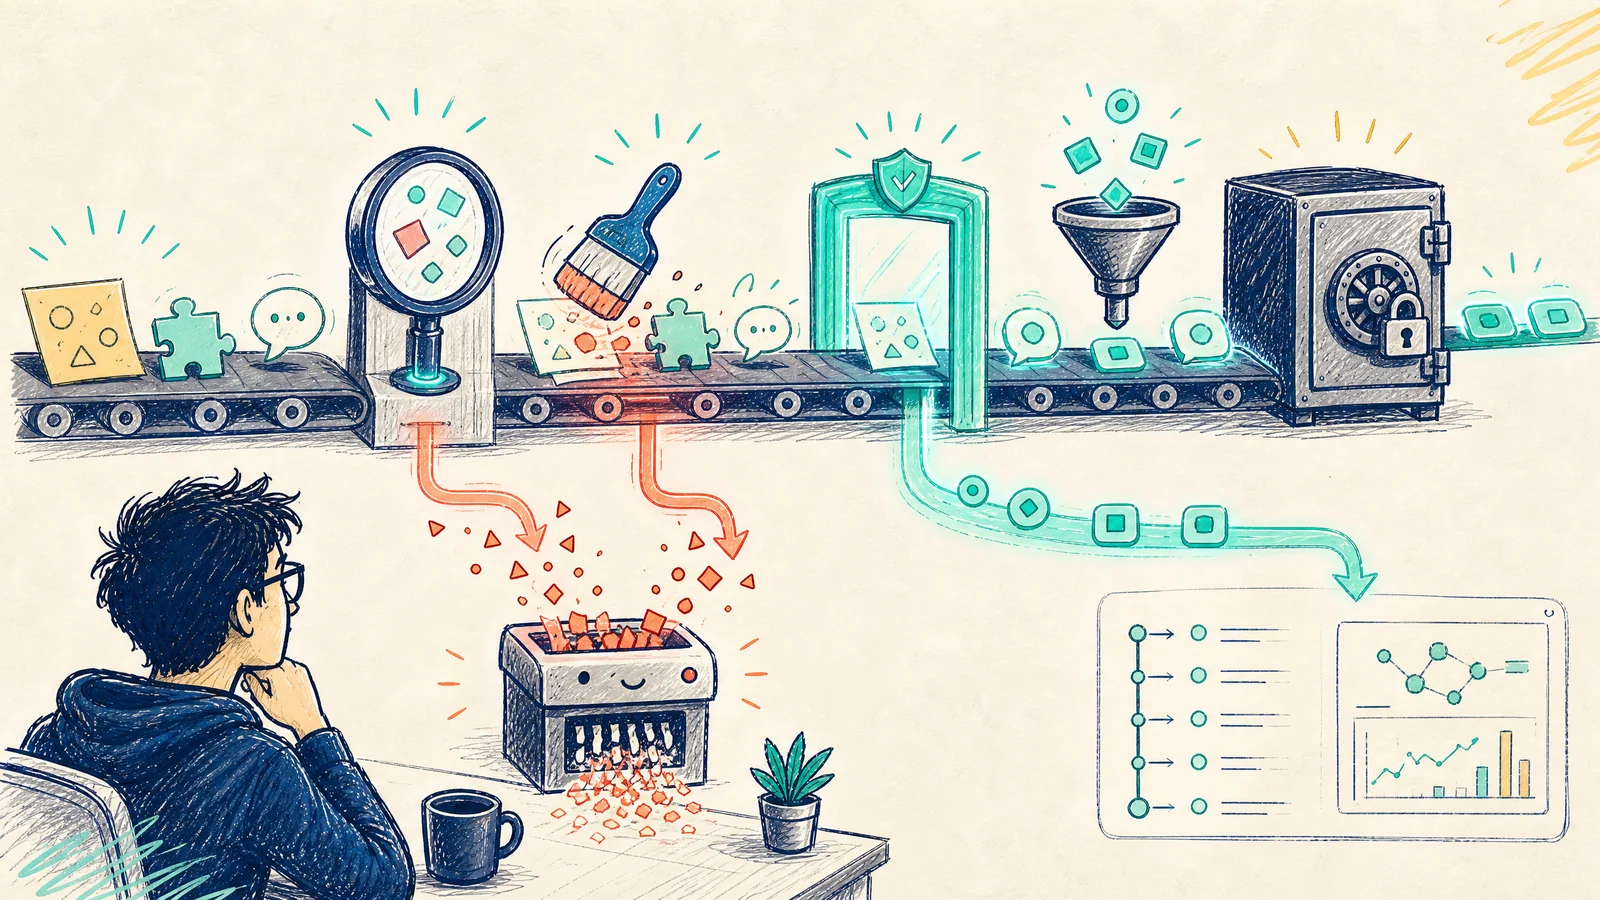
A production design usually needs at least five checkpoints.
| Boundary | Required control | What is still missing if this is your only control? |
|---|---|---|
| 1. Application SDK | Classify and sanitize before setAttribute or export |
New framework integrations or auto-instrumentation may bypass it |
| 2. Instrumentation review | Review field names, callbacks, and auto-capture flags in CI | Runtime payloads from dependencies can still surprise you |
| 3. Collector allowlist | Forward only approved keys; delete or transform the rest | It is too late if data already reached a local buffer or dump |
| 4. Backend routing and RBAC | Split standard trace storage from restricted evidence; encrypt and audit access | Classifiers can still miss semantic PII |
| 5. Detection and tests | Canary secrets, DLP scans, adversarial fixtures, bypass alerts | Detection is not a preventive control |
Do not make backend redaction your primary defense. Once a raw prompt has crossed the network, a queue, a retry buffer, or a third-party service, it may exist in several places. OpenTelemetry provides processors to modify, filter, redact, and transform telemetry, but its guidance is unambiguous: the best way to avoid collecting sensitive telemetry is not to collect it in the first place.
The following is deliberately policy pseudoconfiguration, not copy-paste Collector syntax. Its value is in being reviewable as an allowlist-first contract; validate the exact processor syntax for your Collector version before deploying.
telemetry_policy:
  trace_attributes_allowlist:
    - service.name
    - service.version
    - agent.name
    - agent.version
    - agent.route
    - agent.tool.name
    - agent.tool.capability
    - agent.tool.duration_ms
    - gen_ai.usage.input_tokens
    - gen_ai.usage.output_tokens
    - agent.cost.usd
    - agent.policy.version
    - agent.policy.redacted_fields
  delete_attribute_patterns:
    - ".*prompt.*"
    - ".*message.*"
    - ".*authorization.*"
    - ".*cookie.*"
    - ".*tool.*arguments.*"
    - ".*tool.*result.*"
  export:
    standard_trace_store: metadata_only
    restricted_evidence_store: explicit_break_glass_only
Truncation is not a privacy control
Keeping only the first thousand characters reduces volume; it does not remove sensitivity. An API key can be in the first twenty characters, and an email, name, account number, or private instruction is often at the start of a message. Regex is also incomplete by design. Grafana distinguishes high-confidence secret-pattern sanitization from evaluator/guard approaches that can identify semantically expressed PII, and it documents different coverage for inputs, outputs, streaming, and reasoning blocks.
Test the pipeline with synthetic but hostile fixtures: a fake bearer token, fake email, fake identifier, nested JSON, base64-looking text, a tool result that contains a header, and a streaming response. The test target is not “a beautiful redactor.” It is proof that the raw value cannot appear in an exporter mock, a dead-letter queue, or a standard trace store outside the intended restricted lane.
it("never exports a synthetic bearer token in standard telemetry", async () => {
  const fakeSecret = "Bearer test_only_9Qf7r2Kp";
  const span = new MemorySpan();

  traceToolCall(span, {
    toolName: "get_customer_profile",
    schemaVersion: "v4",
    capability: "read",
    argumentsJson: JSON.stringify({ accountRef: "demo-42" }),
    resultJson: JSON.stringify({ upstreamError: `Authorization: ${fakeSecret}` }),
    durationMs: 68,
  });

  const serialized = JSON.stringify(span.attributes);
  expect(serialized).not.toContain(fakeSecret);
  expect(span.attributes["agent.tool.result.action"]).toBe("redact");
  expect(span.attributes["agent.policy.redacted_fields"]).toBe(1);
});
Trace prompt provenance rather than defaulting to transcript capture
Prompt observability tends to drift to extremes. One team saves nothing and cannot reproduce a regression. Another saves every system instruction, user message, retrieved chunk, tool schema, and completion for every request.
A better approach separates prompt provenance from prompt content.
| What must be known to debug or compare? | Safer representation |
|---|---|
| Which template ran? | Template ID, template revision, git SHA, or prompt-registry revision |
| Was retrieval/context present? | Source count, token budget, context-policy class |
| Did the input change? | Intent class plus scoped HMAC fingerprint, not raw text |
| Was the prompt oversized? | Token count, truncation flag, context-window utilization band |
| Did a policy transform it? | Policy action/revision, match category/count |
| Is exact content truly required? | Separate evidence request with a justification, scope, and TTL |
When groundedness regresses, begin with prompt revision, index revision, tokenized document references, source count, token budget, and evaluation score. If those signals are insufficient, request restricted evidence through a break-glass flow. That deliberately slower path adds friction before a privacy-sensitive act.
Treat tool calls as authority and effect, not as HTTP status
Tool calling is where agent observability must exceed ordinary API logging. HTTP 200 does not mean “safe”: an agent may call a write tool against the wrong tenant, a tool may return far too much PII, an agent may loop a read tool and create a denial-of-wallet incident, or a technically successful action may still require approval.
OWASP identifies tool abuse, excessive autonomy, data exfiltration, prompt injection, denial of wallet, and sensitive data exposure in context or logs as specific agent risks. Its baseline recommendations include least privilege, per-tool scopes, high-impact action controls, monitoring, and data classification.
A good tool span retains behavioral evidence:
agent.tool.name                 = create_refund_draft
agent.tool.capability            = draft
agent.tool.auth_scope_class      = tenant_limited
agent.tool.argument_shape        = {account_ref: tokenized, amount: bucketed}
agent.tool.result_class          = draft_created
agent.tool.effect                = staged_no_external_side_effect
agent.tool.approval_required     = true
agent.tool.approval_state        = pending
agent.tool.retry_count           = 0
agent.tool.policy_action         = allow
argument_shape is not raw JSON. It may encode keys present, types, size buckets, and handling decisions. If amount ranges matter to operational risk, bucket them; do not retain exact values by default. For an email tool, store recipient count, domain category, capability, and approval state—not the email body or recipient address in a standard span.
Measure token, latency, and cost at the span; aggregate after policy
The cost of an agent does not live in one model invocation. It accumulates through planning, fallback models, retrieval expansion, tool loops, and retries. Each model span should therefore include input/output tokens, deployment, finish reason, duration, and a price-card revision. The root span should retain the controlled aggregate.
An illustrative calculation is simple:
span_cost_usd = (input_tokens / 1_000_000 × input_price_per_million)
              + (output_tokens / 1_000_000 × output_price_per_million)

trace_cost_usd = Σ span_cost_usd + tool_metered_cost_usd
Do not hard-code price in a dashboard query. Version a price card, attach billing.price_card_version, and label cost as an estimate when provider billing, caching, or rounding semantics differ. The numbers in this article’s charts are examples, not claims about a model’s current price.

Keep three budgets separate
| Budget | Failure mode it prevents | Illustrative policy |
|---|---|---|
| Per turn | Prompt bloat or runaway output | Warn when context utilization crosses the defined band |
| Per trace | Loops, retry storms, expensive fallback chains | Stop after maximum model turns, tool calls, or estimated cost |
| Per tenant / period | Abuse, rollout regressions, denial of wallet | Quota and anomaly detection by tenant tier and route |
A cost signal does not need a user email, a raw prompt, or complete tool arguments to be useful. Route, model class, prompt revision, tool name, tenant tier, and risk tier are usually sufficient dimensions after cardinality review. LangChain similarly emphasizes that traces make token and latency attribution possible at the step level, while production scale requires sampling and retention because humans cannot read every trace.
Sampling and retention: longer retention is not better observability
Saving full payloads for one hundred percent of traffic creates both cost and blast radius. Dropping all content makes rare investigation harder. The answer is not a single global sampling percentage; it is policy driven by risk and outcome.
| Run class | Standard trace | Restricted evidence | Illustrative retention |
|---|---|---|---|
| Low-risk successful path | Metadata and aggregate metrics | None | 14-day traces, 90-day metrics |
| Error, timeout, or budget breach | Full metadata and policy events | Not automatic | 30-day events |
| High-risk action or denied approval | Full metadata and audit | Explicit evidence request only | 30-day audit, 24-hour evidence |
| Regression/security canary | Full metadata in test | Synthetic fixture only | Follow CI-artifact policy |
| Customer-reported incident | Pinned metadata | Break-glass with reason and two-person approval | Short TTL with deletion verification |
The retention periods are illustrative. Real values must be derived from data classification, jurisdiction, contract, threat model, and incident policy. The non-negotiable property is that every store has an owner, access path, TTL, and deletion semantics. “Our observability backend keeps data forever” is not a retention policy.
Make content debugging a break-glass audit event
Some incidents cannot be resolved from metadata. A provider may encode an unexpected error in a tool response, or an indirect prompt injection may be visible only in a document fragment. The answer is not to set CAPTURE_CONTENT=true globally and promise to turn it off later.
Use a deliberately narrow workflow instead:
- An engineer opens an evidence request with the trace ID, the incident reason, and the minimum necessary fields.
- A policy service evaluates incident severity, data class, tenant restrictions, and approver roles.
- Two independent principals approve restricted or secret evidence.
- Only a sanitized snapshot is decrypted in a dedicated viewer; download and export are blocked or separately audited.
- The system logs requester, fields viewed, time, and operator; TTL expiry triggers verified deletion.
- The investigation produces a safe summary and—where valuable—a synthetic regression or evaluation case.
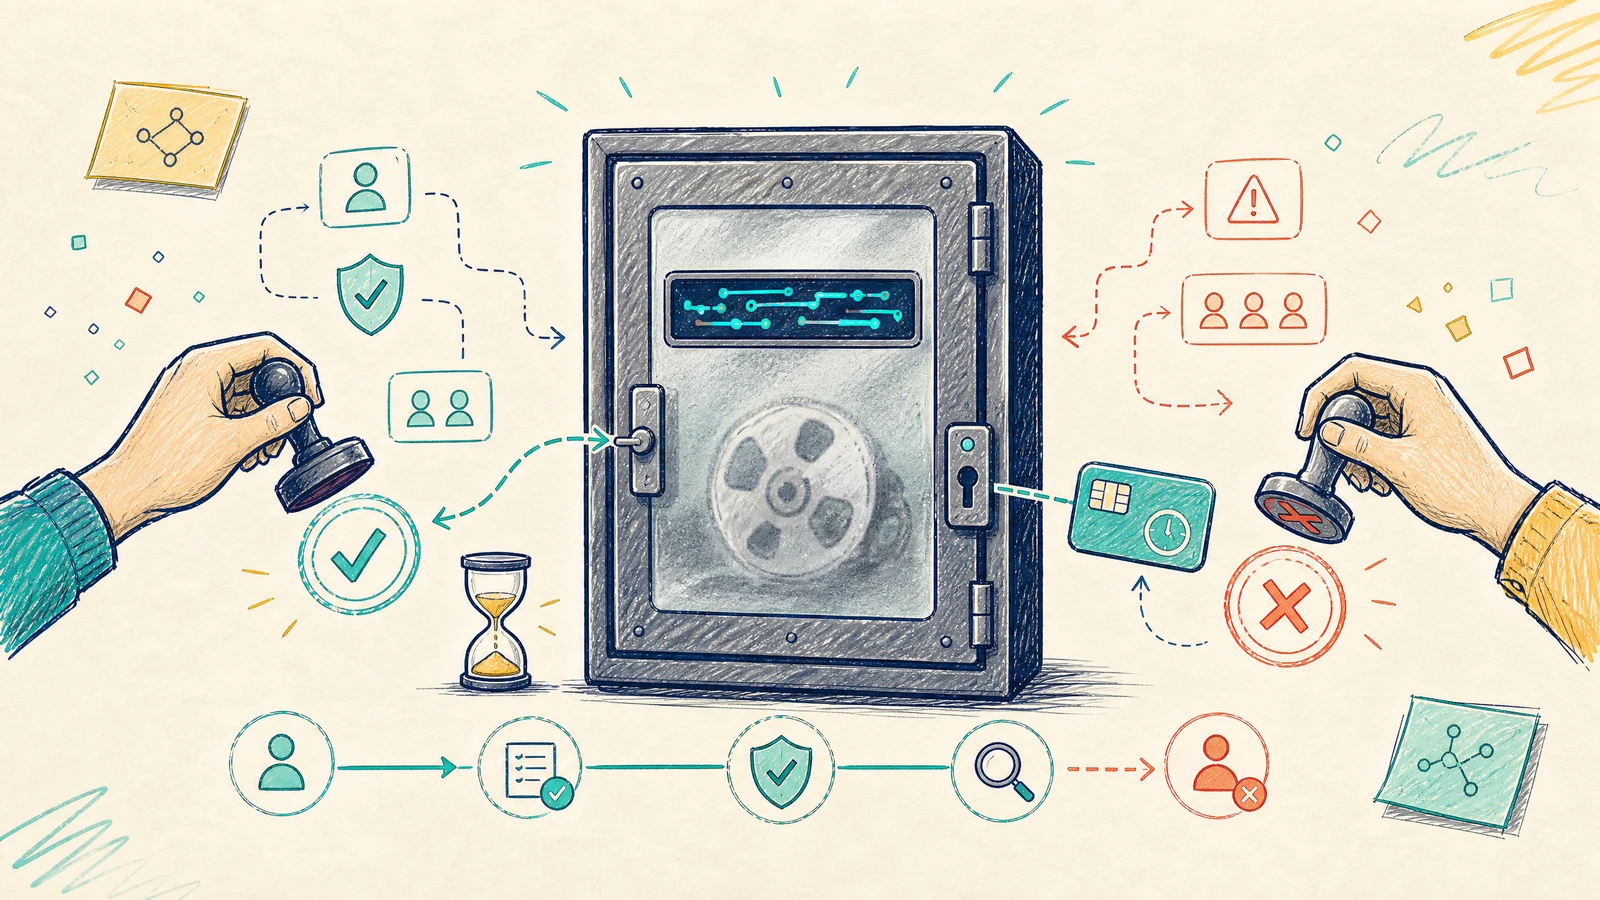
This design feels heavier than an unrestricted trace UI because it is. It creates an auditable boundary and prevents ordinary incident response from becoming routine bulk access to customer conversations. Grafana’s redaction documentation makes the limitation visible: SDK sanitizers and server guards have different coverage, and no single layer automatically covers response content, streaming, and model-thinking blocks in the same way. Break-glass does not replace prevention; it acknowledges legitimate investigative needs without normalizing raw-content access.
Dashboards, alerts, and runbooks should name an action
A useful dashboard is not a gallery of every attribute. It tells an owner what action is appropriate.
| Signal | Dimensions to inspect | Alert condition | First runbook step |
|---|---|---|---|
trace_error_rate |
Agent revision, route, tool name | Baseline shift after rollout | Compare revisions, inspect tool result class, pause canary if necessary |
tool_retry_count |
Tool, provider, region | Retry surge or loop-budget breach | Check upstream health, circuit breaker, and idempotency |
estimated_cost_per_trace |
Route, model class, tenant tier | Budget-band breach | Inspect turn count, context utilization, fallback use |
redaction_action_count |
Policy revision, tool, route | Sudden zero or unusual spike | Verify SDK/Collector pipeline and inspect deployment change |
break_glass_requests |
Data class, team, incident code | Unusual request volume | Security-review the access pattern |
approval_denied_rate |
Capability class, route | Unexpected increase | Check policy/routing regression before requesting content |
A redaction count that suddenly falls to zero after a release can be more urgent than one hundred additional milliseconds of latency. Alert on policy evidence, not on raw payload. Safe observability must observe itself: which policy revision processed a trace, whether fields were dropped, whether an exporter bypassed the intended path, and whether restricted-evidence access is rising.
Failure modes that turn logs into a breach
| Anti-pattern | Why it fails | Better pattern |
|---|---|---|
| Enable content capture globally for a “temporary” incident | An exceptional mode becomes permanent; no data contract exists | Metadata first; explicit break-glass content lane |
| Redact after the vendor ingests data | The payload may already be in transit, a queue, retry buffers, or backups | Sanitize in-process, then enforce a Collector allowlist |
| Hash an email or user ID and call it anonymous | Small input spaces can be re-identified | Scoped/rotated HMAC plus access control; reduce joins |
Retain raw tool results because the tool returned 200 |
Results can include PII, headers, and records | Result class, effect, schema shape, synthetic replay fixture |
| Put user ID or prompt text into a metric label | Cardinality explosion and direct privacy leak | Buckets such as route, revision, and risk tier |
| Redact inputs but ignore outputs and streams | A model or tool can echo secrets and PII | Separate response-side and stream-aware controls |
| Treat an agent trace as ordinary APM | Tool choice, authority, policy, retries, and cost vanish | Agent-aware spans, events, and evaluation feedback |
A 30-day path from console logs to defensible observability
Week 1: define the telemetry contract
Inventory existing fields across SDK auto-capture, custom logs, tool middleware, proxy headers, queue payloads, and vendor exporters. For every field, record owner, purpose, data class, default action, retention, backend, and reader. Drop fields without a purpose. Then map the ten most important incident questions to safe evidence.
Week 2: instrument the hot path
Add root agent, model, retrieval, and tool spans. Capture model/revision/tokens/duration/tool effect/policy decision; default raw content to off. Add price-card revision, retry count, approval state, and safe result class. Build views for error, duration, cost, redaction, and budget decisions.
Week 3: add enforcement and adversarial tests
Implement the SDK sanitizer and Collector allowlist. Create canary fixtures and prove that synthetic secrets never appear in exported spans. Test tool errors, nested JSON, headers, streams, and auto-instrumentation. Have Security and Privacy owners review each new field class.
Week 4: operate the feedback loop
Set sampling and retention, launch the break-glass process, route policy-bypass alerts to on-call, and turn safe incident summaries into regression-evaluation fixtures. MLflow describes agent observability as a combination of tracing, evaluation, monitoring, cost/latency tracking, feedback, and governance; those are parts of one learning loop, not disconnected product features.
Production checklist before you enable content tracing
| Question | Pass condition |
|---|---|
| Do you inventory auto-instrumentation? | You know which libraries can capture prompt/tool content and which flags disable it |
| Do default spans contain raw prompts, tool arguments/results, headers, or memory? | No; every raw-content path is explicit and tested |
| Can you explain a slow, expensive, wrong, or unsafe run with metadata? | Root tree, revisions, tokens, durations, retries, effects, and policy evidence are present |
| Can cost be reproduced from a price-card revision? | Yes, and estimates are labeled as estimates |
| Does redaction run before export? | Yes; SDK/in-process control is primary and Collector is defense in depth |
| Do canary tests cover secrets and PII? | Yes; exporter mocks and pipeline integration are scanned |
| Does restricted evidence have RBAC, justification, TTL, and audit? | Yes; broad engineering access is not the default |
| Do incidents feed the evaluation suite? | Safe summaries and synthetic fixtures have owners |
Closing thought
Mature agent observability is not “everything is searchable.” It is the ability to answer, quickly and with evidence: what the agent did, why it did it, what it cost, whether it crossed policy, and which change produced the behavior—without loading prompts, customer data, and tool payloads into an open log repository.
Start with less data and stronger structure: revisions, trace shape, token/cost, tool effect, policy action, and controlled fingerprints. Then build a truly narrow restricted-evidence lane for the minority of incidents that need exact context. If you cannot name the incident question a field exists to answer, treat that field as a potential data leak—not as unfinished observability.
References
[1] OpenTelemetry — Inside the LLM Call: GenAI Observability with OpenTelemetry
[2] OpenTelemetry — Handling sensitive data
[3] Grafana Cloud documentation — PII and secrets redaction
[4] OWASP Cheat Sheet Series — AI Agent Security Cheat Sheet
[5] NIST — Challenges to the Monitoring of Deployed AI Systems
[6] LangChain — AI Agent Observability: Tracing, Testing, and Improving Agents
Comments (0)